A/B Testing with Feature Flags: How to
Feature management solutions like Unleash are great for enabling A/B/n experiments. However, setting up these experiments can be challenging, especially when dealing with complex rollouts or inter-team dependencies.
In this guide, we’ll explore how feature flags can be used for A/B testing. We’ll walk you through the fundamentals of A/B testing, explain why feature flags are critical for success, share best practices for progressive rollouts, and explain how to conduct an A/B/n test in 3 simple steps using Unleash and Google Analytics.
What is A/B testing?
A/B testing is a controlled experiment that compares two or more variations of a feature, design, or experience to determine which performs better. It allows teams to make data-driven decisions by analyzing how users respond to each version.
To conduct an A/B test, a target audience is divided into groups, each exposed to a different variation. Metrics such as user engagement, conversion rates, or satisfaction levels are tracked to identify the most effective option.
A/B testing using feature flags
Feature flags streamline the A/B testing process by enabling teams to deploy and manage multiple variations of a feature without redeploying code. With feature flags, you can dynamically assign user groups to specific variations, providing real-time control over the test.
This approach simplifies experimentation by allowing instant adjustments to audience segmentation or feature behavior as insights emerge. Feature flags also ensure a smooth rollback to a previous version if the test reveals performance issues or adverse user impacts.
Why feature flags are important for A/B testing
Feature flags are essential for A/B testing, enabling precise and controlled experimentation. They streamline the testing process, allowing developers to easily switch between feature variants without deploying new code. This reduces the risk of introducing bugs and makes it simpler to roll back changes if needed. Additionally, feature flags provide the flexibility to dynamically adjust user exposure, facilitating data-driven decisions that optimize user experience and feature performance.
Challenges when implementing A/B testing
- Implementing complex targeting rules: Dividing users into logical groups based on complex targeting rules can be challenging
- Sending impression data to analytics tools: Sending data on the performance of test variants to core analytics tools for analysis can be complex.
- Consistent user experience: Ensuring that the same user receives the same variant across sessions requires customer coding.
Best practices when implementing A/B testing
- Advanced segmentation: Create reusable segments so that you can easily apply tests to the logical groups such as beta users, users in a particular geographic region or users on a particular device type.
- Seamless integration: Establish seamless integration between your feature flagging and core analytics tools to send data on test variant performance automatically. This reduces complexity and ensures accurate data flow for analysis.
- Session Persistence Mechanisms: Implement mechanisms to ensure session persistence to guarantee that users receive the same variant across different sessions, providing a stable and reliable user experience.
A/B/n experiment with Unleash feature flags: How to
This guide will show you how you can get started with A/B/n experiments in 3 simple steps using Unleash, all handled within the team.
Before we begin, there are some basics that you should have in place:
- Unleash. This is to create and manage the A/B/n test in your application.
- A preferred analytics tool. In this guide, we provide a step-by-step guide using Google Analytics.
- A clear understanding of the business goals of the development team. The development team need to understand the KPIs they want to improve through their A/B testing.
Our reference case is built on a joint effort we did together with the Norwegian Labor and Welfare Organization (NAV). NAV uses Unleash self-hosted as part of their software toolbox.
Step 1: Define an alternative to the targeted KPI
The first enabling step for any A/B/n experiment is to define an alternative that you believe will perform better on your target KPI. For simplicity: Let’s assume that the experiment will test the call-to-action button color. You expect a green button will perform better than the existing blue.
You then need to decide on what part of the traffic you want to perform the experiment on. In this case, you decide that you want to run the experiment on 50% of the traffic.
Here’s how to do it:
1) Log into your Unleash instance
2) Create a new feature flag by pressing the “New feature flag” button.

3) Give the feature flag a name according to your naming convention. The example shows “AB_experiment.”
4) We also recommend that you give the feature flag a short description. This is for your reference and documentation.
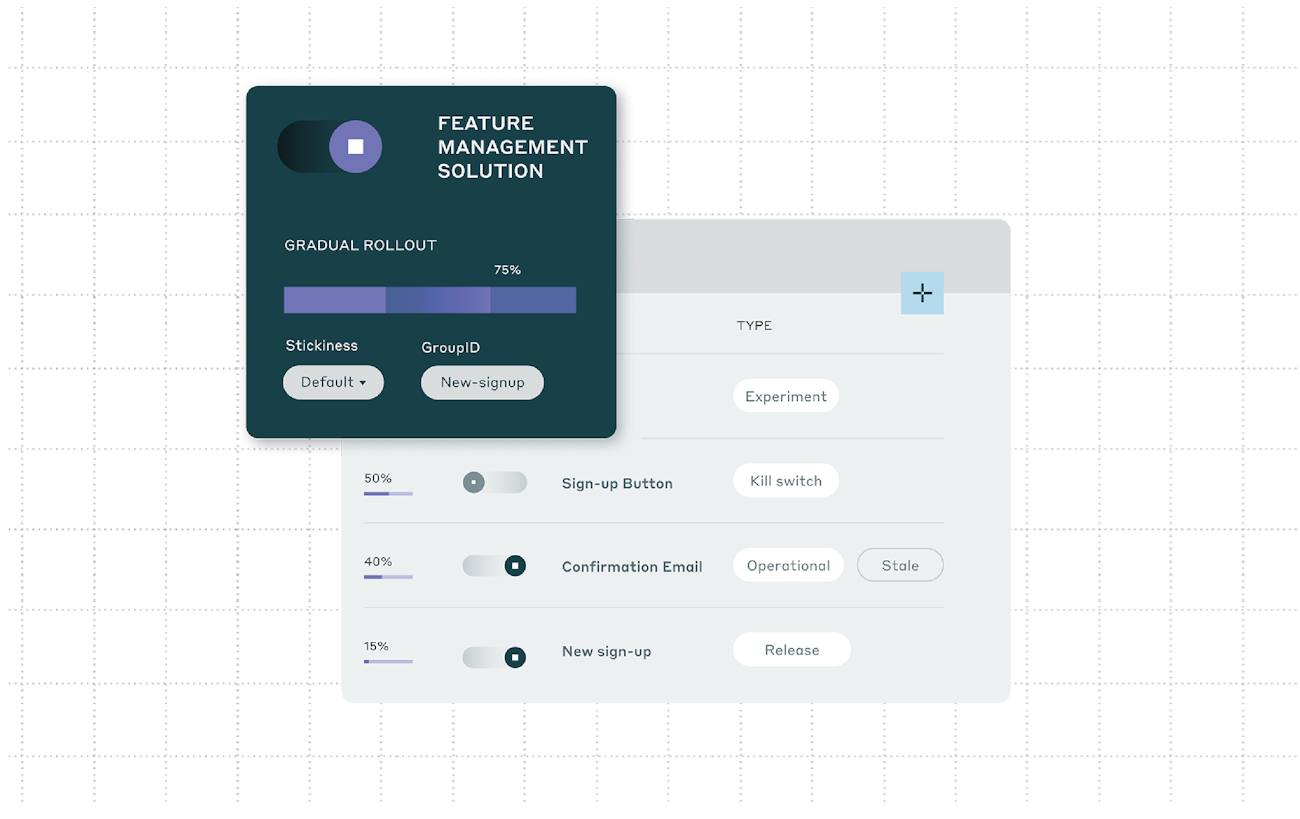
5) Now you need to choose an activation strategy. The example runs an experiment on 50% of the traffic. This means a “gradual rollout” strategy makes sense.
This activation strategy means that the Unleash engine will pick out 50% of the users to be part of the experiment, as the percentage is set to “50%.”
You also want to make the experiment sticky. This means that if a user has seen the experiment once, we want this user to have a consistent experiment.
The example includes the user identifcation (UID) to create stickiness, as UID is part of the user context in the Super Insurance web application.

6) Now you want to create the variants that contain the actual experiment. Here you’re able to define a new variant, as well as a control variant. It is worth noticing that all the variants will be weighted equally.
There are many variants you’ll be able to define. In this example, we have created two: “BlueButton” is the control variant, while “GreenButton” is the alternative we want to test.

Step 2: Set up the experiment in Google Analytics
To visualize your A/B/n experiment results in Google Analytics, you can choose to use “Custom dimensions.” You will find this by logging onto the Google Analytics admin console: Click “Custom definitions”, “Custom dimensions” and then “New custom definition”.

In this example, we’ve chosen to call the custom dimension “featureToggleName.” The name itself is irrelevant to the Unleash SDK, but the user needs to know the id of the dimension reserved for the Unleash data.
We have also chosen to use the “Session” scope on the dimension. Usually, for a user that returns to the site after a day or two, the experiment might not be that relevant to that specific user. This article provides additional details on the available scopes for custom dimensions.
H3 – Step 3: Connecting the dots
The last step in setting up the A/B/n experiments is to connect the experiment with the metrics. The developer in the team now needs to enter a few lines of code to get the magic to happen. In the source code below, you can see where both the Unleash SDK and Google Analytics SDK are running.
const toggleName = ‘AB_feature_toggle’;
const variant = unleash.getVariant(toggleName);
console.log(variant.name);
// Map ‘dimension4’ to ‘unleash’:
gtag(‘config’, ‘UA-YOUR_ID-1’, { ‘custom_map’: {‘dimension4’: ‘unleash’}});
// Send an event that passes ‘variant’ as a parameter:
gtag(‘event’, ‘unleash_dimension’, {‘unleash’:`${toggleName}:${variant.name}`});
Your experiment is now up and running. You’ll be able to explore the results of the experiment using your already existing reports and views in Google Analytics. The Custom dimensions are available as a secondary dimension that you can easily access. If you are using Google Tag Manager you can pass the data to the data layer, then onwards to your analytics tool such as Google Analytics.
First, create your event JSON and push it to the data layer like so:
dataLayer.push({ //send data to GTM
  ‘event’: ‘unleash’, //name your event
  ‘feature’: ‘new-logo’, //name of the feature
  ‘variant’: ‘control’ //name of the variant the user sees
})
Then, in Google Tag Manager, create 4 tags
- One custom event to trigger when your Unleash event is passed
- One data layer variable to store the name of your feature
- One data layer variable to store the name of your feature variant
- One Google Analytics event tag to send the data to Google Analytics when the custom event triggers
The Unleash approach to A/B testing
Feature flags are a great way to run A/B or multivariate tests with minimal code modifications, and Unleash offers built-in features that make it easy to get started.
Unlike proprietary software where users are bound to the product roadmap determined by the company (and its shareholders), an open-source feature management system allows you to modify and improve the software based on your specific use cases. Our users are not bound or dependent on the limitations of our code.
Unleash open source is available as a docker container, or click-to-deploy in Heroku and Digital Ocean. Choose your preferred deployment and get started in minutes.
While there are other proprietary tools such as LaunchDarkly, we believe there are a lot of benefits to using an open-source system like ours. See for yourself.