Manage technical debt: measure the impact and prioritize improvements guided by development data
Sustainable software development is about balancing short- and long-term goals. A product needs to grow with new features and capabilities while ensuring that the codebase remains maintainable and well-understood so that the business can add new features. A failure to balance these goals leads to technical debt, which in turn impacts your road map, time to market, and customer satisfaction. As such, technical debt impacts the whole organization:
- Development teams: As a developer, it’s challenging to communicate around something as deeply technical as code and explain why it needs to improve
- Managers and Product owners: As a manager, I tend to notice symptoms of technical debt like long lead times and frequent rework. But without active coding skills, it’s virtually impossible to assess the root cause. Besides, given all potential technical debt, where do we start?
Code Quality issues are not Technical Debt
Technical debt is often mistaken for “bad code in general”. This is a dangerous fallacy that leads organizations to waste months on improvements that don’t have a clear business outcome or aren’t urgent. To identify technical debt, we need to go beyond source code and combine two dimensions:
- The quality dimension: is it more expensive or higher risk to modify a piece of code than it should be?
- The relevance dimension: what’s the impact of any quality issues?
Let’s start by looking at some examples from the real world:
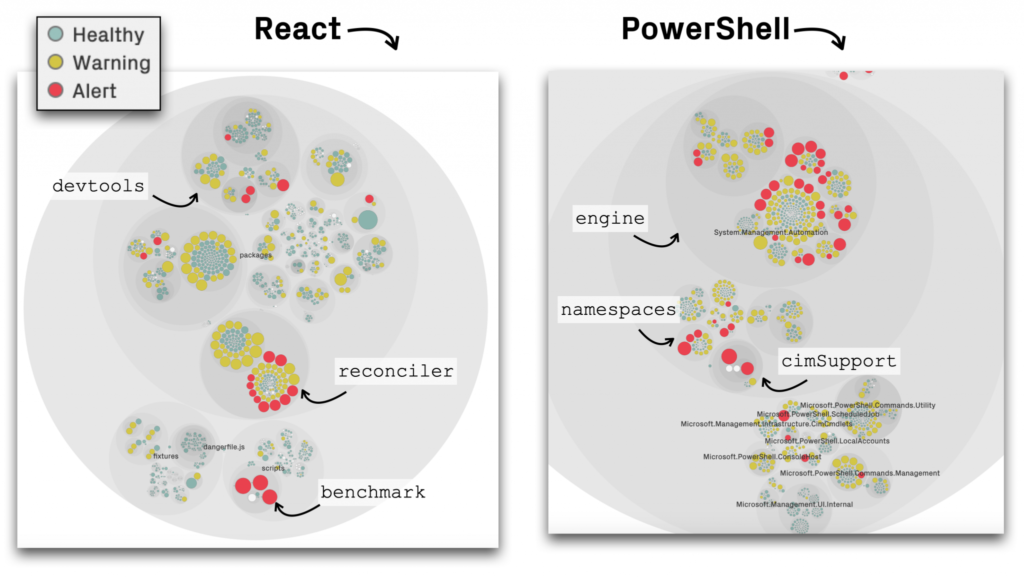
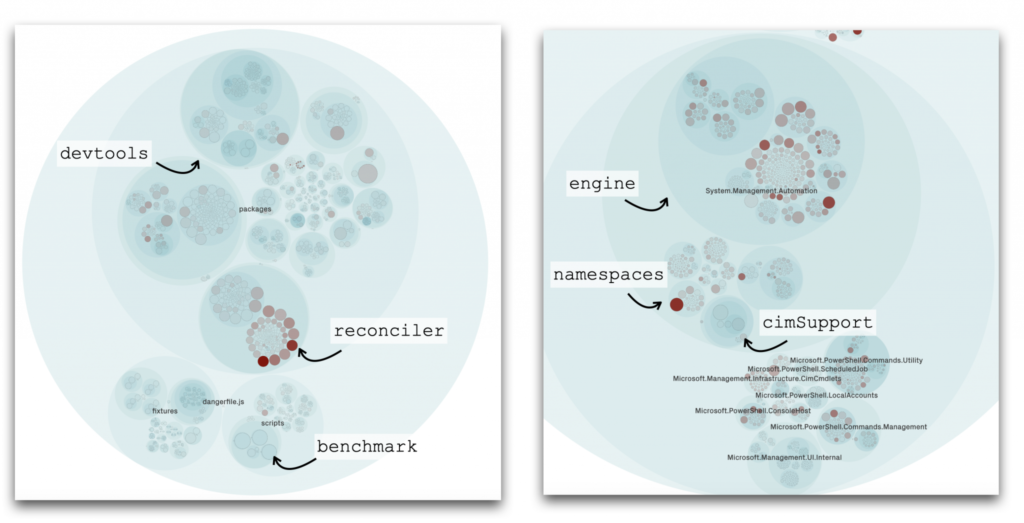
The preceding figure shows the first piece of the technical debt puzzle, the quality dimension. This case study uses the code health metric. Code health is a module-level metric that looks for factors known to correlate with increased maintenance costs, the risk for defects, and security vulnerabilities. The example visualizes two codebases, which allows us to make a quick assessment:
- React: React is a powerful library for building user interfaces. We see that there are a handful of modules that seems to have accumulated code health issues. In particular, there seem to have accumulated code health issues in the “react-reconciler” part that warrens further inspection.
- Powershell: Powershell is a platform and scripting language that helps us automate common tasks. The visualization identifies several modules with code health issues, most of the inside the core “engine”.
Prioritize code quality issues by development impact
Technical debt cannot be estimated from code alone. In fact, the main danger in prioritizing improvements, redesigns, etc. based on code complexity alone is that we miss the most important decision point: impact. What if all those modules in `react-reconciler` have been stable for 5 years? What if half of the red modules in the PowerShell `engine` haven’t been modified over the past year? Starting to speculatively refactor the code there is not only a technical risk; it could also be a wasted opportunity to improve a part of the codebases that makes a huge difference in developer productivity. This is where behavioural code analysis helps.
In a behavioural code analysis, the code itself is important. But it’s even more important how the code evolved and how the development teams interacted with the code. This is information we can get by tapping into version-control systems like Git. In particular, we can mine the change frequency — number of commits — of each piece of code and use that as a proxy for developer impact. When combines with a complexity metric like code health, we can identify complicated code that we have to work with often:
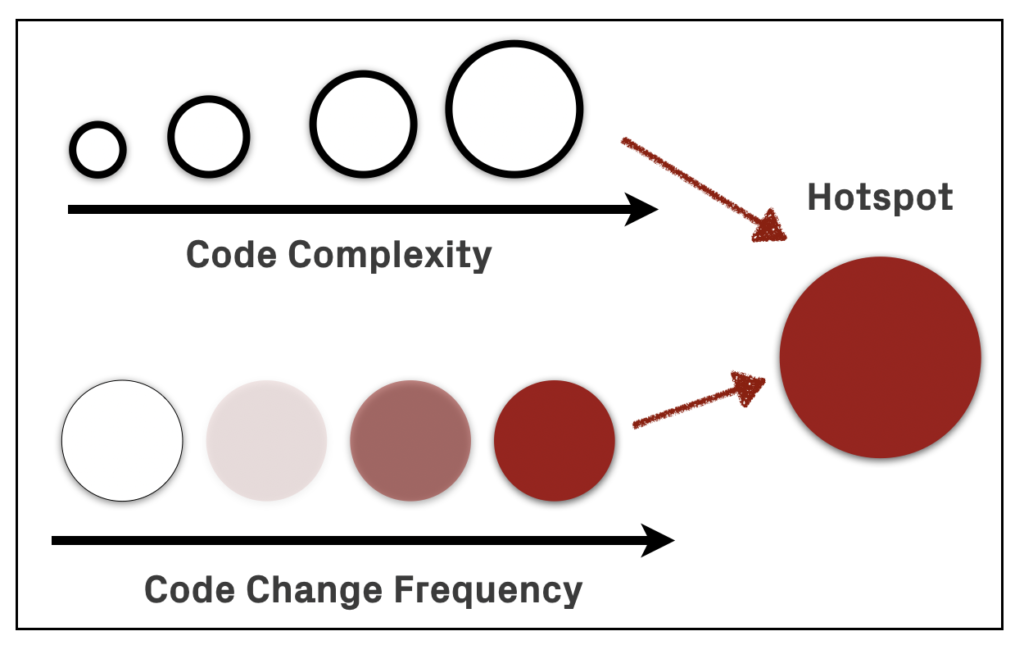
Armed with development hotspots, we get a different perspective that lets us prioritize the previous findings in React and PowerShell:
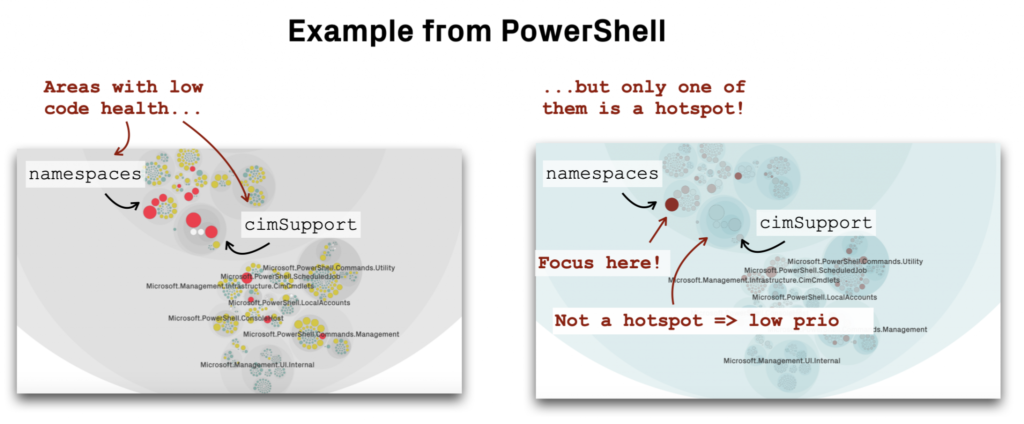
The big win with hotspots is that they limit the information to what’s actionable. For example, in React, we see that there are two clear hotspots in the `reconciler` package that overlap with low code health.
But even more important is that a hotspot analysis shows us what we do not necessarily have to jump on right now. An example comes from `cimSupport` in PowerShell which has two low code health modules, but they only had one or two commits in that area over the past year. Hence, it’s technical debt (low code health) but also with low interest (change frequency):
Act on Hotspots
Information is only good when acted upon. So what’s the next step once you have an initial hotspot analysis? Let’s look at three different use cases to manage technical debt:
Use hotspots to communicate the current situation
Effective improvements have to start with getting situational awareness. This is challenging since internal software quality lacks visibility. That makes it hard to communicate the need for larger refactoring to non-technical stakeholders, which have to balance the effort against the desire to add more user-facing features.
A hotspots analysis helps to bring that much-needed visibility. I have also found it useful to complement hotspots with another behavioural code analysis technique: complexity trends.

A complexity trend quickly shows if a hotspot is a growing problem, or if it is under control. I often use these together with hotspots when communicating the need to pay down technical debt. It’s a simple technique that’s easy to interpret visually.
Prioritize improvements based on data
Code bases like `React` and `PowerShell` have been developed over several years. As such, it’s not uncommon to find several areas with lower code health. However, as discussed earlier, most organizations cannot act on all of those findings. Rather, it’s about making sure we invest improvements in the parts of the code that has the largest return on investment. This is where hotspots shine:
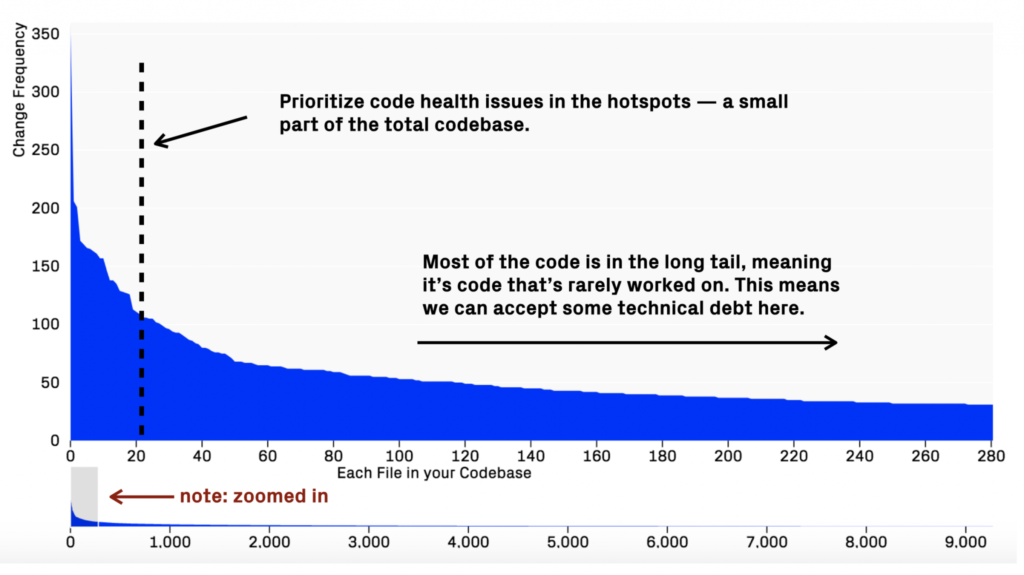
The preceding graph shows the change frequency (as measured by the number of commits) per file. As you see, most development activity is in a small part of the codebase. This is the part where even a minor amount of technical debt gets expensive due to the high interest. On the other hand, most of the code is in the long tail, meaning it’s code that we rarely if ever need to work on. That’s the part of the code that has lower priority when it comes to addressing code health issues.
As such, hotspots send a positive message: no, we don’t need to pay down all technical debt. Instead, we can focus on the parts where we are most likely to have a real return on investment based on our unique organizational fingerprint.
Be pro-active: supervise hotspots in your pull requests
Over the past 5 years, I have been fortunate to analyze hundreds of codebases. By using complexity trends, I often see that the most complex hotspots have been problematic for years; once we have taken on code quality issues and technical debt, it simply seems to stick around and grow worse over time. And this brings me to one of the most important lessons I’ve learned: the first step towards managing technical debt is to avoid taking on more debt.
One way of doing that is by integrating hotspot information in pull requests so that we can detect code health issues before they appear on the main branch. That way, hotspots can support your development team as an early feedback loop so that we can act upon any negative trends and take the codebase in the desired direction. No matter what baseline we start from, we never want our code to become worse.
Learn more and explore hotspots
Technical debt and code quality issues cost time, money, and missed deadlines. That’s why it’s vital to know when you can safely move ahead and implement new features as well as when you might have to take a step back and improve what’s already there. It’s a hard balance. A hotspot analysis helps you stay on top of it and communicate when to tip that scale.
Hotspots – and the general topic of behavioural code analysis – is a broad topic, and we have really just scratched the surface of what’s possible. There are more examples in my GOTO 2019 talk, and if you want to dig deeper, I’ve written a whole book – Software Design X-Rays – about this topic and other related analyses.
The case studies in this article use the free community edition of CodeScene, including automated pull request checks of hotspots.